
Showing posts with label APOTD. Show all posts
Showing posts with label APOTD. Show all posts
Thursday, February 28, 2013
APOTD: Ghost Nebula

Caption: NOAO
This image was obtained with the wide-field view of the Mosaic Camera on the Mayall 4-meter telescope at Kitt Peak National Observatory. vdB 141 is a reflection nebula located in the constellation Cepheus. Sometimes referred to as the ghost nebula, its awkward name is its catalog number in Sidney van den Bergh's catalog of reflection nebulae, published in 1966. Several stars are embedded in the nebula. Their light gives it a ghoulish brown color. North is down and East is to the right. Imaged August 28, 2009.
Image: T.A. Rector/University of Alaska Anchorage, H. Schweiker/WIYN and NOAO/AURA/NSF [high-resolution] Read NOAO Conditions of Use before downloading
Tuesday, January 29, 2013
APOTD: Molecular Cloud in Monoceros
 |
| Image: T.A. Rector (University of Alaska Anchorage) and N.S. van der Bliek (NOAO/AURA/NSF) [high-resolution] Read NOAO Conditions of Use before downloading |
Caption: NOAO
This image was obtained with the wide-field view of the Mosaic II camera on the Blanco 4-meter telescope at Cerro Tololo Interamerican Observatory on January 11th, 2012. It shows a portion of the giant Monceros R2 molecular cloud. It is a location of massive star formation, particularly in the location of the bright red nebula just below the center of the image. The image was generated with observations in the Sulphur [SII] (blue) and Hydrogen-Alpha (red) filters. In this image, north is to the right, and east is up.
Wednesday, January 23, 2013
APOTD: Soap Bubble Nebula
 |
| Image: T. A. Rector/University of Alaska Anchorage, H. Schweiker/WIYN and NOAO/AURA/NSF [high-resolution] |
Caption: NOAO
nformally known as the "Soap Bubble Nebula", this planetary nebula (officially known as PN G75.5+1.7) was discovered by amateur astronomer Dave Jurasevich on July 6th, 2008. It was noted and reported by Keith Quattrocchi and Mel Helm on July 17th, 2008. This image was obtained with the Kitt Peak Mayall 4-meter telescope on June 19th, 2009 in the H-alpha (orange) and [OIII] (blue) narrowband filters. In this image, north is to the left and east is down.
PN G75.5+1.7 is located in the constellation of Cygnus, not far from the Crescent Nebula (NGC 6888). It is embedded in a diffuse nebula which, in conjunction with its faintness, is the reason it was not discovered until recently. The spherical symmetry of the shell is remarkable, making it very similar to Abell 39.
:
Monday, January 21, 2013
APOTD: Saturn's Glowing Aurora
 |
| Image: NASA/JPL/University of Arizona/University of Leicester[high-resolution] |
Caption: Cassini Solstice team
This false-color composite image, constructed from data obtained by NASA's Cassini spacecraft, shows the glow of auroras streaking out about 1,000 km (600 miles) from the cloud tops of Saturn's south polar region. It is among the first images released from a study that identifies images showing auroral emissions out of the entire catalogue of images taken by Cassini's visual and infrared mapping spectrometer.
In this image constructed from data collected in the near-infrared wavelengths of light, the auroral emission is shown in green. The data represents emissions from hydrogen ions in of light between 3 and 4 microns in wavelength. In general, scientists designated blue to indicate sunlight reflected at a wavelength of 2 microns, green to indicate sunlight reflected at 3 microns and red to indicate thermal emission at 5 microns. Saturn's rings reflect sunlight at 2 microns, but not at 3 and 5 microns, so they appear deep blue. Saturn's high altitude haze reflects sunlight at both 2 and 3 microns, but not at 5 microns, and so it appears green to blue-green. The heat emission from the interior of Saturn is only seen at 5 microns wavelength in the spectrometer data, and thus appears red. The dark spots and banded features in the image are clouds and small storms that outline the deeper weather systems and circulation patterns of the planet. They are illuminated from underneath by Saturn's thermal emission, and thus appear in silhouette.
The composite image was made from 65 individual observations by Cassini's visual and infrared mapping spectrometer on 1 November 2008. The observations were each six minutes long.
Monday, January 14, 2013
APOTD: Tectonics on Enceladus

On Oct. 5, 2008, just after coming within 25 kilometers (15.6 miles)
of the surface of Enceladus, NASA's Cassini captured this stunning
mosaic as the spacecraft sped away from this geologically active moon of
Saturn.
Craters and cratered terrains are rare in this view of the southern
region of the moon's Saturn-facing hemisphere. Instead, the surface is
replete with fractures, folds, and ridges—all hallmarks of remarkable
tectonic activity for a relatively small world. In this enhanced-color
view, regions that appear blue-green are thought to be coated with
larger grains than those that appear white or gray.
Portions of the tiger stripe fractures, or sulci, are visible along the
terminator at lower right, surrounded by a circumpolar belt of
mountains. The icy moon's famed jets emanate from at least eight
distinct source regions, which lie on or near the tiger stripes.
However, in this view, the most prominent feature is Labtayt Sulci, the
approximately one-kilometer (0.6 miles) deep northward-trending chasm
located just above the center of the mosaic.
Near the top, the conspicuous ridges are Ebony and Cufa Dorsae. This
false-color mosaic was created from 28 images obtained at seven
footprints, or pointing positions, by Cassini's narrow-angle camera. At
each footprint, four images using filters sensitive to ultraviolet,
visible and infrared light (spanning wavelengths from 338 to 930
nanometers) were combined to create the individual frames. The mosaic is
an orthographic projection centered at 64.49 degrees south latitude,
283.87 west longitude, and it has an image scale of 196 kilometers
(122.5 miles) per pixel. The original images ranged in resolution from
180 meters (594 feet) to 288 meters (950 feet) per pixel and were
acquired at distances ranging from 30,000 to 48,000 kilometers (18,750
to 30,000 miles) as the spacecraft receded from Enceladus. The view was
acquired at a Sun-Enceladus-spacecraft, or phase, angle of 73 degrees.
Image: NASA/JPL/Space Science Institute [high-resolution]
Caption: NASA
Sunday, December 30, 2012
APOTD: A Star Making Waves

VIA: NASA/JPL:
"The giant star Zeta Ophiuchi is having a "shocking" effect on the surrounding dust clouds in this infrared image from NASA's Spitzer Space Telescope. Stellar winds flowing out from this fast-moving star are making ripples in the dust as it approaches, creating a bow shock seen as glowing gossamer threads, which, for this star, are only seen in infrared light.
Zeta Ophiuchi is a young, large and hot star located around 370 light-years away. It dwarfs our own sun in many ways -- it is about six times hotter, eight times wider, 20 times more massive, and about 80,000 times as bright. Even at its great distance, it would be one of the brightest stars in the sky were it not largely obscured by foreground dust clouds.
This massive star is travelling at a snappy pace of about 54,000 mph (24 kilometers per second), fast enough to break the sound barrier in the surrounding interstellar material. Because of this motion, it creates a spectacular bow shock ahead of its direction of travel (to the left). The structure is analogous to the ripples that precede the bow of a ship as it moves through the water, or the sonic boom of an airplane hitting supersonic speeds.
The fine filaments of dust surrounding the star glow primarily at shorter infrared wavelengths, rendered here in green. The area of the shock pops out dramatically at longer infrared wavelengths, creating the red highlights.
A bright bow shock like this would normally be seen in visible light as well, but because it is hidden behind a curtain of dust, only the longer infrared wavelengths of light seen by Spitzer can reach us.
Bow shocks are commonly seen when two different regions of gas and dust slam into one another. Zeta Ophiuchi, like other massive stars, generates a strong wind of hot gas particles flowing out from its surface. This expanding wind collides with the tenuous clouds of interstellar gas and dust about half a light-year away from the star, which is almost 800 times the distance from the sun to Pluto. The speed of the winds added to the star's supersonic motion result in the spectacular collision seen here.
Our own sun has significantly weaker solar winds and is passing much more slowly through our galactic neighborhood so it may not have a bow shock at all. NASA's twin Voyager spacecraft are headed away from the solar system and are currently about three times farther out than Pluto. They will likely pass beyond the influence of the sun into interstellar space in the next few years, though this is a much gentler transition than that seen around Zeta Ophiuchi.
For this Spitzer image, infrared light at wavelengths of 3.6 and 4.5 microns is rendered in blue, 8.0 microns in green, and 24 microns in red.
JPL manages the Spitzer Space Telescope mission for NASA's Science Mission Directorate, Washington. Science operations are conducted at the Spitzer Science Center at Caltech. Data are archived at the Infrared Science Archive housed at the Infrared Processing and Analysis Center at Caltech."
For more information about Spitzer, visit http://spitzer.caltech.edu and http://www.nasa.gov/spitzer.
Sunday, December 16, 2012
APOTD: 5 Galaxy Pile Up
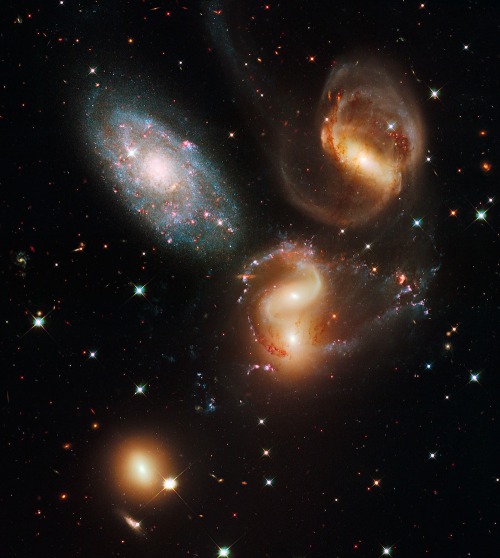
This portrait of Stephan’s Quintet, also known as the Hickson Compact Group 92, was taken by the new Wide Field Camera 3 (WFC3) aboard the NASA/ESA Hubble Space Telescope. Stephan’s Quintet, as the name implies, is a group of five galaxies. The name, however, is a bit of a misnomer. Studies have shown that group member NGC 7320, at upper left, is actually a foreground galaxy that is about seven times closer to Earth than the rest of the group.
Three of the galaxies have distorted shapes, elongated spiral arms, and long, gaseous tidal tails containing myriad star clusters, proof of their close encounters. These interactions have sparked a frenzy of star birth in the central pair of galaxies. This drama is being played out against a rich backdrop of faraway galaxies.
The image, taken in visible and near-infrared light, showcases WFC3’s broad wavelength range. The colours trace the ages of the stellar populations, showing that star birth occurred at different epochs, stretching over hundreds of millions of years. The camera’s infrared vision also peers through curtains of dust to see groupings of stars that cannot be seen in visible light.
Image: NASA, ESA and the Hubble SM4 ERO Team [high-resolution]
Caption: Hubble Heritage Team
VIA: Wired Science
Wednesday, May 23, 2012
APOTD: Late Afternoon SHadows at Endeavour Crater on Mars
 |
| Image credit: NASA/JPL-Caltech/Cornell/Arizona State Univ. |
NASA’s Mars Rover Opportunity catches its own late-afternoon shadow in this dramatically lit view eastward across Endeavour Crater on Mars.
The rover used the panoramic camera (Pancam) between about 4:30 and 5:00 p.m. local Mars time to record images taken through different filters and combined into this mosaic view.
Most of the component images were recorded during the 2,888th Martian day, or sol, of Opportunity’s work on Mars (March 9, 2012). At that time, Opportunity was spending low-solar-energy weeks of the Martian winter at the Greeley Haven outcrop on the Cape York segment of Endeavour’s western rim. In order to give the mosaic a rectangular aspect, some small parts of the edges of the mosaic and sky were filled in with parts of an image acquired earlier as part of a 360-degree panorama from the same location.
Opportunity has been studying the western rim of Endeavour Crater since arriving there in August 2011. This crater spans 14 miles (22 kilometers) in diameter, or about the same area as the city of Seattle. This is more than 20 times wider than Victoria Crater, the largest impact crater that Opportunity had previously examined. The interior basin of Endeavour is in the upper half of this view.
The mosaic combines about a dozen images taken through Pancam filters centered on wavelengths of 753 nanometers (near infrared), 535 nanometers (green) and 432 nanometers (violet). The view is presented in false color to make some differences between materials easier to see, such as the dark sandy ripples and dunes on the crater’s distant floor.
VIA: NASA.gov
Subscribe to:
Posts (Atom)

